The battery is the most expensive part of your EV and the one everybody worries about. It is also, on the evidence, the part least likely to let you down.
The largest real-world dataset available now covers more than 22,700 vehicles, and it says the average pack loses about 2.3% of its capacity a year. That is not a cliff. It is a slow fade that leaves most batteries outlasting the cars around them — provided you avoid the handful of habits that genuinely accelerate it.
This guide covers what the data actually shows, how to check your own pack, and which of the widely repeated “battery care” rules survive contact with evidence.
What degradation actually is
A lithium-ion pack doesn’t fail like a bulb. It loses the amount of energy it can hold, gradually, through chemical changes inside the cells. A car that once showed 300 miles might show 270 a decade later. The car drives identically; the tank is quietly smaller.
That loss is measured as State of Health (SoH) — current usable capacity as a percentage of original. New is 100%. The curve is not a straight line: most packs drop a few percent in the first year or two as the chemistry settles, then flatten out into small steady annual losses.
This matters when you’re reading your own numbers. A one-year-old car showing 96% has not developed a problem — it has done the normal early settling. Panic at that point is the most common misreading in EV ownership.
The numbers, from the largest study available
Geotab’s 2026 battery health analysis tracked over 22,700 vehicles across 21 makes and models using telematics rather than laboratory testing. The headline: 2.3% average annual loss, projecting to about 81.6% capacity after eight years.
| Age | Typical SoH | 300-mile car shows roughly |
|---|---|---|
| New | 100% | 300 miles |
| 3 years | ~93% | 279 miles |
| 5 years | ~89% | 267 miles |
| 8 years | ~82% | 246 miles |
| 10 years | ~77% | 231 miles |
Charging habits are one lever, but not the only one — this piece looks at habits specifically; the fuller picture of what actually drives degradation sits in our battery health guide.
There’s a wrinkle worth explaining, because it looks alarming out of context. An earlier Geotab study found 1.8% per year; the newer figure of 2.3% is worse on paper. Batteries did not get worse. The newer study widened from 11 models to 21, pulling in newer vehicles showing their normal first-year dip, and the newer fleet fast-charges considerably harder. The average is being pulled up by how people charge, not by how batteries hold up.
That distinction is the whole point of this article, because it means the number is partly under your control.
What actually accelerates degradation
1. Heavy DC fast charging — the dominant factor
This is the clearest finding in the data. Vehicles using high-power DC fast charging for more than 12% of their sessions degrade at up to 3.0% per year. Vehicles charging mostly on AC sit nearer 1.5%.
That’s the difference between roughly 88% and roughly 78% capacity at eight years — on the same car, from charging behaviour alone.
The nuance matters, though: it’s the proportion, not the occasional use. Fast charging on road trips is what the capability exists for. The pattern that hurts is fast charging as the primary method — which is precisely the situation of an owner with no home charging.
2. Heat
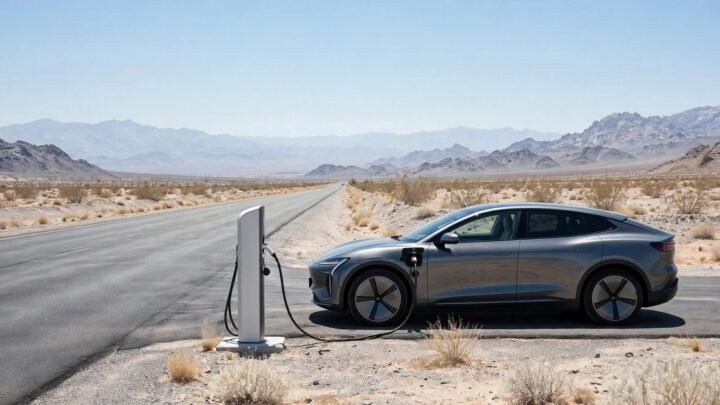
Calendar ageing happens whether you drive or not, and heat accelerates it. A pack sitting in a hot garage loses capacity without turning a wheel. This is why identical cars age differently in Arizona and Oregon, and why older air-cooled EVs without active thermal management degraded so badly in hot states.
Keeping a parked EV cooler also slows heat-related degradation at the margins — see what ceramic window tint actually saves in our cost breakdown.
3. Sustained extremes of charge — but less than you’ve been told
Here the data pushes back on conventional advice. The familiar “keep it between 20% and 80%” rule turns out to matter only under sustained extremes. Vehicles that spent under 80% of their cumulative time at very high or very low charge showed almost no difference — 1.4% versus 1.5% per year. Only vehicles spending more than 80% of their time parked at extreme states of charge saw a meaningful jump, to around 2.0%.
Translation: leaving your car at 90% for a weekend is irrelevant. Habitually parking it at 100% or near-empty for months is what costs you.
4. Vehicle type and chemistry
Multi-purpose vehicles and light vans averaged 2.7% annual degradation against 2.0% for light passenger cars — partly because their battery chemistries are optimised for range rather than longevity. If you’re comparing your figure to an average, compare against your class of vehicle.
How to check your own battery health
Three methods, in ascending order of reliability.
The range comparison. Charge to 100%, note the estimated range, divide by the original EPA rating. Free, and rough — the estimate is derived from recent driving efficiency, so a cold week or a heavy right foot depresses it without any degradation existing. Use it as a trend indicator across months, not as a measurement.
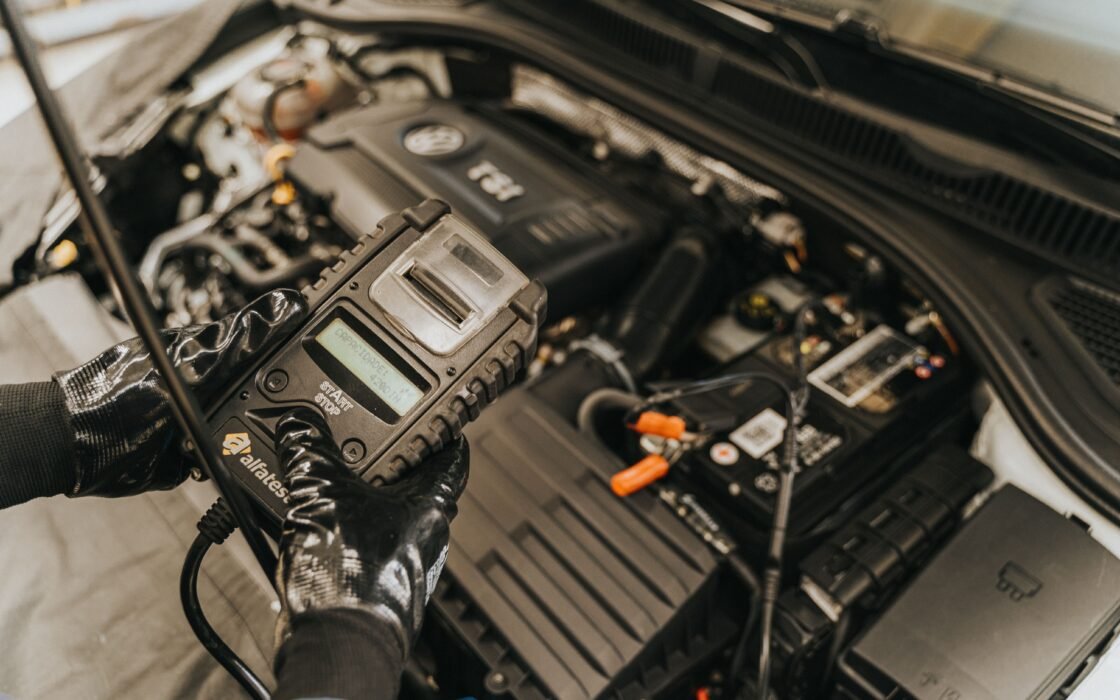
An OBD-II dongle. A Bluetooth adapter costs $35–$100 and, with a model-specific app, reads State of Health directly from the battery management system. This is a real number rather than an inference, and it often exposes cell-level detail. For most owners this is the right tool.
A professional battery report. Independent EV inspection services and dealer diagnostics produce a formal SoH figure. Worth paying for when you’re buying, selling, or building a warranty claim.
Whichever you use, measure the same way each time. Same season, same charge level, same method. A single reading tells you almost nothing; a series of readings tells you your degradation rate.
Want numbers for your own car? Here is how to check your EV’s battery health step by step.
Six habits that actually help
In rough order of impact:
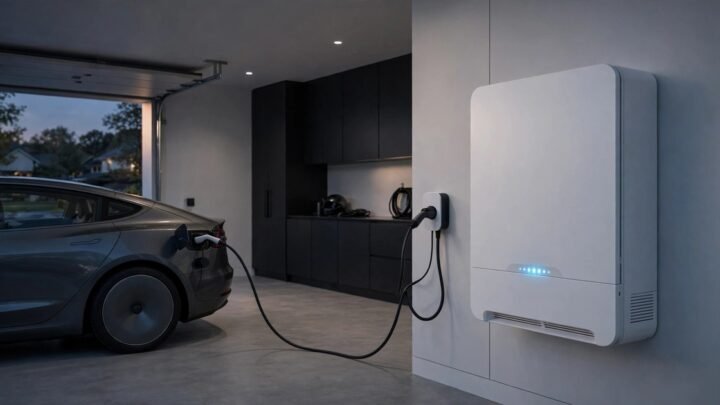
- Make AC charging your default. This is the big one. Home charging overnight, with fast charging reserved for trips, is the single largest lever you have — worth roughly half the degradation rate of a fast-charge-dependent car. If you haven’t sorted out home charging, our guide to Level 1 vs Level 2 charging covers what you actually need.
- Park in shade or a garage in hot climates. Calendar ageing plus heat is the combination that quietly destroys packs, and it costs nothing to avoid.
- Don’t store it at extremes for long periods. Leaving the car for weeks at 100% or near-empty is the version of this rule that’s supported by evidence. For a long absence, aim for something around half charge.
- Use the daily charge limit if your car has one — but treat it as a mild optimisation, not a moral obligation. If you need the full range for a trip, charge to 100% and drive.
- Check whether you have LFP. Lithium iron phosphate packs are designed to be charged to 100% routinely, and many manufacturers actively recommend it for calibration. Applying NMC advice to an LFP car is a mistake.
- Precondition before fast charging in cold weather. A cold pack accepting high current is harder on the battery than a warm one. Most cars will do this automatically if you navigate to a charger.
When degradation is a warranty problem
Federal rules require manufacturers to warrant EV batteries for at least 8 years or 100,000 miles, whichever comes first, with some vehicles sold in ZEV states carrying up to 10 years or 150,000 miles. Coverage typically triggers if capacity falls below a stated threshold, commonly 70–75%.
Red flags worth investigating rather than accepting:
- More than 20% capacity loss in under five years
- Below 70% while still inside the warranty window
- A sudden step change rather than a gradual decline
- Significant imbalance between cells in a diagnostic scan
If you think you have a claim, documentation decides it. Keep dated SoH readings, records of charging habits, software update history and any dealer diagnostics. A series of readings showing an abnormal trend is a far stronger case than one bad number.
Frequently asked questions
How long will my battery actually last? On current data, longer than most people keep cars. At 2.3% a year a pack is still above 80% at eight years and around 77% at ten — degraded, but entirely usable. Battery failure inside a normal ownership period is the exception, not the expectation.
What does a replacement cost? Less than it used to, and falling — pack costs dropped to roughly $108 per kWh in 2025, and out-of-warranty replacement pricing has followed. It remains a major expense, which is why warranty status matters so much when buying used.
Does fast charging on road trips damage my battery? Occasional fast charging is not the problem; the data is about proportion. If fast charging is under about 12% of your sessions, you’re in the low-degradation group.
My range dropped suddenly this winter — is my battery failing? Almost certainly not. Cold weather temporarily reduces available capacity and raises consumption, and it fully reverses when temperatures rise. See why EV range drops in winter. Real degradation is gradual and permanent; a seasonal dip is neither.
Does battery health affect resale value? Increasingly yes, and buyers are getting better at checking. A documented SoH history is becoming a genuine selling point — and its absence, a negotiating lever for the buyer.
The short version
Expect roughly 2% a year, faster in the first year and slower after. At eight years a typical pack still holds over 80% of its original capacity, and the biggest variable separating a good outcome from a poor one is how you charge — AC by default, DC for trips.
Measure your own SoH the same way twice a year and watch the trend rather than any single figure. Most owners who do this discover the thing they worried most about is the thing that’s ageing best.
Worth separating two batteries that get confused constantly: the traction pack degrades slowly, while the small 12-volt battery is what actually leaves people stranded.
Sources
Geotab 2026 EV battery health study — analysis of more than 22,700 vehicles across 21 makes and models, including degradation rates by charging behaviour, state-of-charge exposure and vehicle class. Federal high-voltage battery warranty minimums (8 years / 100,000 miles) and ZEV-state extensions. Battery pack cost figures reflect 2025 industry reporting. Degradation projections are averages across a large fleet; individual results vary substantially with climate, chemistry and charging history.