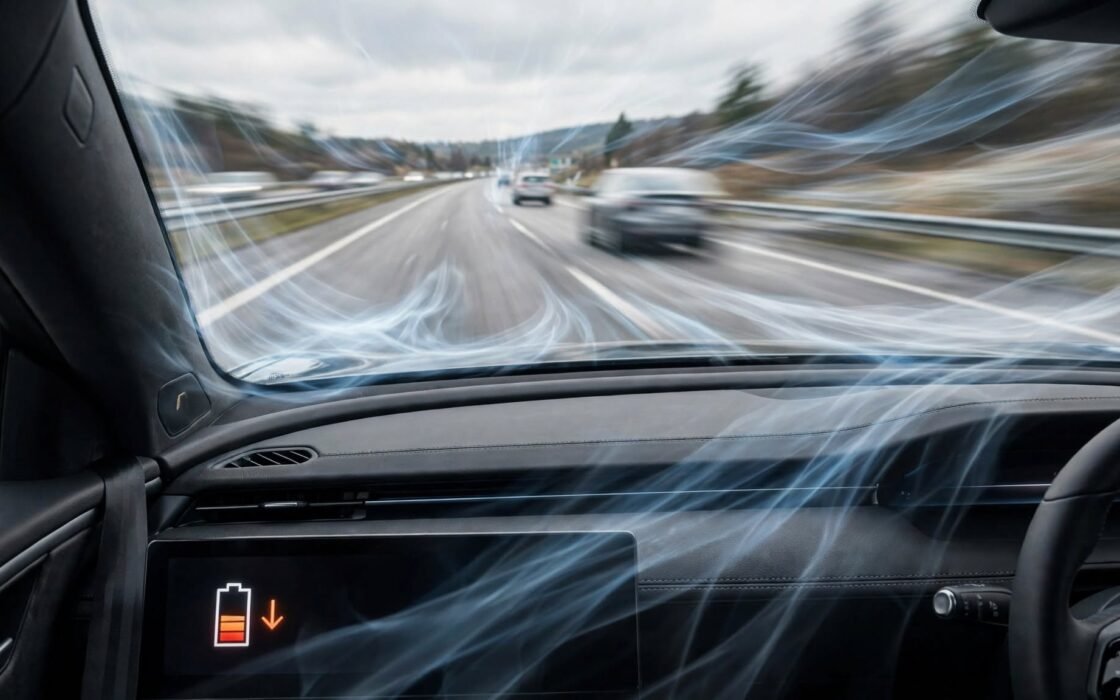
Cruise at 80 mph instead of 60 and your electric car can quietly shed a third of its driving range. Not because the battery is degrading and not because of the weather. It happens because of air: the one range killer no software update fixes, and one that punishes EVs far more visibly than it ever punished gas cars.
Speed vs. Range: The Fast Facts
- A 65 kWh electric van loses 39% of its range going from 50 to 80 mph; sedans lose 28% (Geotab, 3M+ real trips, July 2025).
- At 80 mph the air demands 2.37x the power it demands at 60 mph. That is the cube law, and our calculation below.
- Across 140,000+ EVs in China, sustained high-speed driving cut range by 15-25% on average, up to 40% for some models (ICCT, 2023).
- Slowing down by 10-15 mph can extend range by 20-30%. Turning off the A/C cannot compete with that.
The short answer: Your EV’s range collapses at highway speed because the power needed to push air aside rises with the cube of your speed. Real-world fleet data shows a 28-39% range loss between 50 and 80 mph. Slowing down 10-15 mph is the single biggest thing you can do for range, bigger than switching off the air conditioning or preconditioning the battery.
The physics, in plain English
Two separate rules run your highway range, and they multiply against each other.
First, the force of air resistance grows with the square of your speed. Double your speed and the air pushes back four times as hard. That is why the steering feels heavier and the wind noise climbs so fast past 70.
Second, the power needed to overcome that force grows with the cube of your speed, because power is force times speed. So the jump from 60 to 80 mph is not a 33% harder job. It is (80/60)^3 = 2.37 times the power, just to move the same air out of the way. That is our calculation, and it is the whole story in one number.
At city speeds this barely matters: tire rolling resistance and stop-and-go losses dominate. But around 50-55 mph the curves cross, and by 75 mph fighting drag is the single biggest thing your battery does.
Gas cars obey the same physics, but a gas engine wastes roughly three-quarters of its fuel as heat regardless, so extra drag is a smaller slice of an already wasteful pie, and refueling takes five minutes. An EV drivetrain is around 85-90% efficient, so every extra kilowatt the air demands comes straight out of your range with nowhere to hide.
What the real-world tests actually show
Physics predicts the shape of the curve. Fleet data fills in the numbers.
In July 2025, the telematics company Geotab published an analysis of more than 3 million real EV trips, comparing sedans and cargo vans at steady cruising speeds in 86F heat with the air conditioning running. The results are the cleanest speed-vs-range dataset in public:
| Cruising speed | 65 kWh van | Sedan |
|---|---|---|
| 50 mph | 143 miles | 277 miles |
| 60 mph | 121 miles | 251 miles |
| 70 mph | 103 miles | 226 miles |
| 80 mph | 88 miles | 200 miles |
| Total loss, 50 to 80 mph | 39% | 28% |
Two things stand out: even slippery sedans lose 77 miles between 50 and 80 mph, and the van loses far more because a tall flat front punches a bigger hole in the air. Shape matters as much as speed.
Other datasets agree. A 2023 ICCT study of more than 140,000 battery EVs in China found sustained high-speed driving (above roughly 55 mph) cut range by 15-25% on average, with some models losing up to 40%. A 36-EV group test at a steady 81 mph measured losses from 18% for the slipperiest cars to 54% for the boxiest, versus their official ratings. And on a 2025 European road trip, eight EVs cruising at 80 mph lost around 40% of their rated range; a Renault 4 E-Tech sipped 4.5 miles per kWh on slower roads but gulped 2.67 miles per kWh on the highway, turning a theoretical 234-mile range into 139 miles.
Our calculation: checking the math against Geotab’s data
Anyone can quote the cube law. We wanted to know whether a simple model built on it can actually predict real cars.
The model: split the energy your car uses per mile into two parts. One part is roughly constant with speed (tires, electronics, drivetrain losses). The other part is aerodynamic drag, which grows with the square of speed. Pick one number, the share of energy going to drag at a reference speed, and the curve is fully determined:
energy(v) = energy(65) x [ (1 – s) + s x (v/65)^2 ]
We fitted s, the drag share at 65 mph, to Geotab’s two endpoints (50 and 80 mph) and got about 35% for sedans and about 55% for boxier SUVs and vans. Then we asked the model to predict the two middle points it had never seen.
| 60 mph: model vs measured | 70 mph: model vs measured | |
|---|---|---|
| Van | 120.7 vs 121 miles | 101.9 vs 103 miles |
| Sedan | 250.4 vs 251 miles | 224.8 vs 226 miles |
The model lands within roughly 1% of the measured data at both unseen speeds, for both body styles. The calculator below is this model with your numbers plugged in, not a guess dressed up as math.
One honest caveat: the model is fitted to the 50-80 mph band where Geotab measured. Below 40 mph, auxiliary loads like climate control start dominating and the curve flattens in ways this model does not capture, so treat very low-speed projections as rough.
Estimate your range at any speed
Enter your EV’s real efficiency at a known speed and the tool projects your efficiency and range at any cruising speed. Defaults are examples, not facts about your car.
How the tool works. It converts your efficiency to energy per mile, rescales it to 65 mph using the fitted drag share (about 35% of energy going to drag for sleek cars, about 55% for boxy ones, fitted to Geotab’s 2025 fleet data), then projects it to your target speed with the square law. Range is simply usable battery divided by energy per mile. The drag shares are fleet averages, so a slippery sedan with aero wheels will beat the estimate and a lifted truck with a roof box will miss it. Wind, hills, temperature, and tire pressure are not in the model.
Why SUVs and trucks get punished harder
Drag is not just speed. The full formula multiplies speed squared by drag area: the drag coefficient (Cd) times frontal area (A). A sleek sedan might be Cd 0.23 through 2.3 square meters of air; a full-size electric pickup can be Cd 0.5 or worse with a far bigger frontal area. Double the drag area and you double the drag power at every speed.
That is why the van lost 39% where the sedan lost 28%, and why the boxiest cars in the 36-EV test shed over half their rated range at 81 mph. It is also why bolt-on gear hurts: roof racks and cargo boxes can cost you double-digit range on their own, stacked on top of the speed penalty.
Speed beats heat, but winter is a different animal
In summer, your right foot matters more than your air conditioner: at 50 mph the A/C is a noticeable slice of energy use, but at 80 mph drag drowns it out completely.
Winter flips the script. The real damage comes from slowed battery chemistry and cabin heating drawing several kilowatts continuously, which is why cold weather cuts EV range through a different mechanism. A winter highway trip at 75 mph stacks both penalties; that combination, not speed alone, produces the horror stories of halved range.
Air-conditioning in hot weather is another quiet range thief — AAA measured 8.5–17% range loss at 95°F depending on the car — and our EV window tint cost guide runs the honest math on whether ceramic film pays for itself in charging savings.
Who should actually slow down
If you charge at home and commute 40 miles, drive whatever speed you like. Slowing down pays off for three groups:
Road-trippers threading charger gaps. The difference between 75 and 65 mph on a 200-mile leg can be the difference between arriving with 15% battery and calling a flatbed. Navigation apps estimate consumption at the speed limit, so their arrival estimates go optimistic fast when you cruise above it.
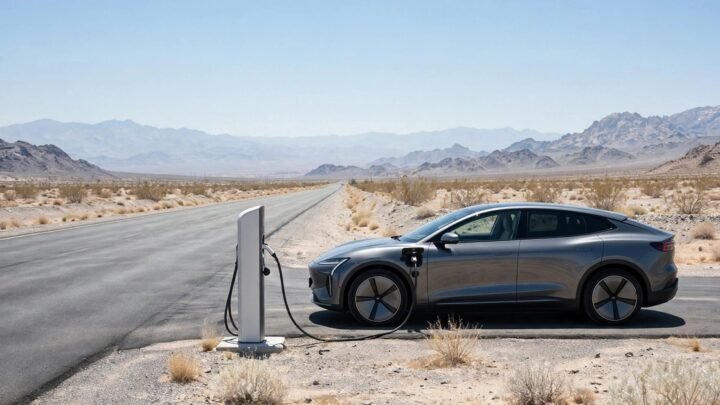
Drivers in charger deserts. If the next fast charger is 150 miles out and your car does 170 miles at 75 mph, you have no margin for wind or hills. Ten mph slower buys roughly 15-20% more range.
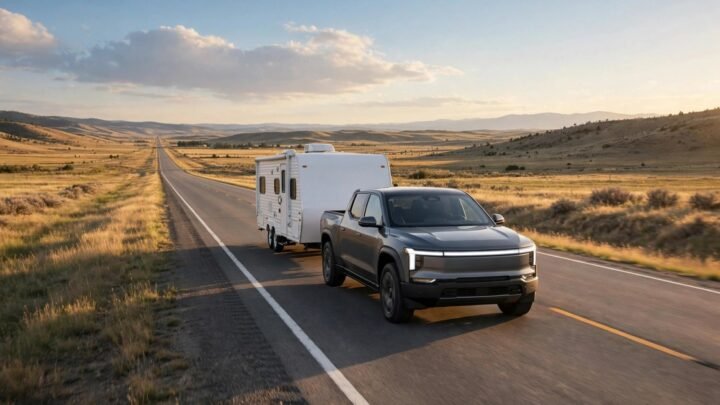
Anyone towing or loaded with gear. Trailers and roof boxes multiply the drag area, which multiplies the speed penalty. The cube law does not negotiate.
Practical ways to win range back
Slowing down is the big lever. These are the smaller ones, roughly in order of impact:
Keep your tires right. Rolling resistance is about 16% of an EV’s total energy use; underinflated tires push that higher for zero benefit, and EV-specific tires can add around 7% range versus ordinary rubber. Since tires are one of the biggest recurring costs of EV ownership, this one pays twice.
Mind the wheels. Bigger wheels are heavier and churn more air. The gap between 19-inch and 21-inch wheels on the same car can be 5-10% of range, which is why base trims often out-range the fancy ones.
Ditch the drag you bolted on. Roof boxes, bike racks, and even open roof rails add drag area at exactly the speeds where drag dominates. Take them off when you are not using them.
Use cruise control on flat highways. Human feet surge and fade; a steady speed avoids the acceleration spikes that waste energy. Aggressive driving can raise consumption 16-30%, and most of that is avoidable.
Rule out the battery before blaming speed. If your range has fallen at all speeds, that is a different problem. Here is how to check your EV’s battery health before assuming the highway is at fault. And remember that phantom drain while parked can quietly eat a few percent overnight, which looks like a range problem but is not a driving problem.
Real questions, straight answers
Is the EPA range rating measured at highway speed?
Partly. The EPA label is a weighted blend of several test cycles, including a high-speed cycle that hits 80 mph, but it also includes lots of gentle city driving where EVs shine on regen. That is why steady 70-mph tests often land 10-30% below the label: Consumer Reports drives EVs at a constant 70 mph until empty, and even excellent cars like the Lucid Air come up about 13% short of their EPA figure in that test. Treat the EPA number as a mixed-driving estimate, not a highway promise.
Why don’t gas cars lose range the same way?
They lose efficiency too, but it shows up less. A gas engine turns only about a quarter of its fuel into motion, so extra drag is a smaller fraction of an already huge waste pile. And a gas tank holds an enormous amount of energy with a five-minute refill, so nobody plans around it. An EV’s drivetrain is so efficient that drag becomes the main event, and the “refuel” takes half an hour.
Does cruise control really help?
Yes, on flat highways. It holds a steadier speed than your foot, avoiding the acceleration spikes that waste energy. On hilly terrain some adaptive systems brake downhill instead of coasting, which can slightly hurt, but for most drivers cruise wins.
Will drafting behind a truck extend my range?
Enormously, in physics terms. But the following distances where drafting pays off leave no room to react, and truck tires throw debris. The range is not worth the risk.
Do bigger wheels really matter that much?
More than most buyers expect. Larger wheels add unsprung weight and usually come with wider, grippier tires that raise rolling resistance, plus more turbulent airflow around the arches. Five to ten percent of range between wheel options on the same car is common: 15-25 miles on a long-range EV.
Is slower always better for range?
No. Below roughly 40 mph, fixed loads like climate control and electronics become a bigger slice of each mile, so efficiency per mile falls again. Most EVs are happiest in the 40s to low 50s mph. The curve is U-shaped; highway driving sits on the steep right wall.
The bottom line on speed
Your EV is not broken when its range melts on the highway; it is doing what physics demands. The data is unambiguous, from 3 million Geotab trips to 140,000 Chinese EVs. The fix is free: slow down 10 mph and you win back 10-20% of your range. Tires, wheels, roof boxes, and climate settings are fine-tuning on top of that one decision. Add a trailer and the speed penalty gets steeper still — see our EV towing range breakdown for how the numbers change at 60 versus 70 mph.
Written by Shurah, who researches and writes independently on the real cost of EV ownership — charging, maintenance, and total cost of ownership — backed by primary data and original calculations rather than recycled lists.